Introduction: Why Understanding the Market Cycle Matters for Indian Investors
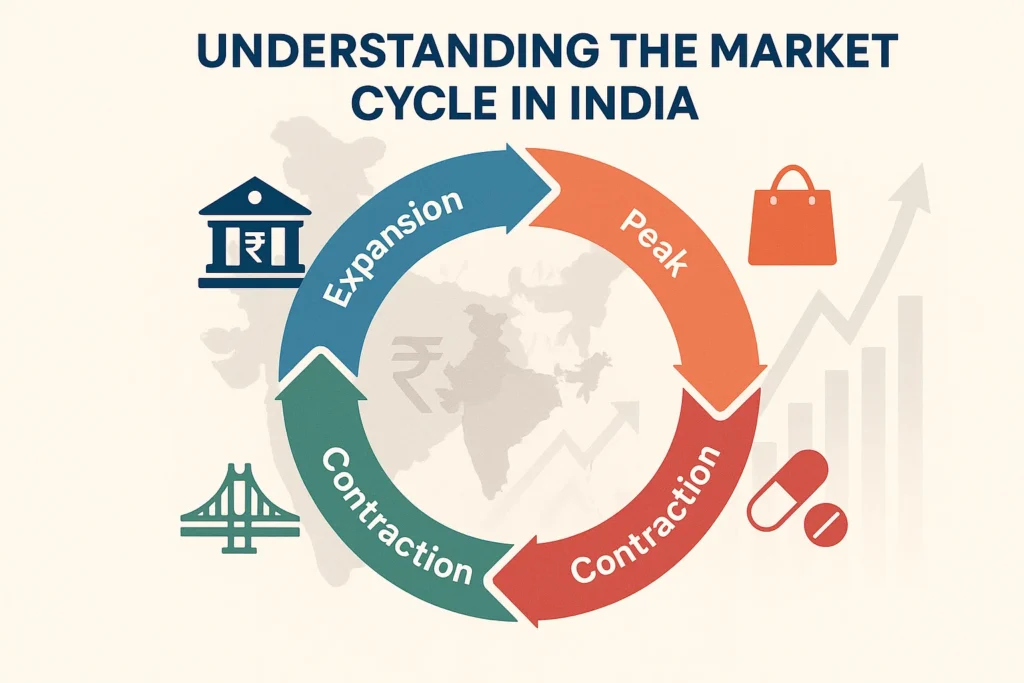
The stock market is often seen as a roller coaster—but beneath the daily swings lies a more structured rhythm known as the market cycle. It’s a pattern of growth, peak, decline, and recovery that plays out across years and influences nearly every aspect of investing. Understanding this cycle—and how it aligns with the broader economic phases of India’s economy—can give investors a powerful edge.
India, being one of the world’s fastest-growing economies, has its own distinct cycles shaped by domestic consumption, global trade, government reforms, inflation, and the Reserve Bank of India’s (RBI) monetary policy. These economic phases don’t just affect GDP numbers—they determine which sectors thrive and which underperform.
For example, while auto and banking stocks typically surge in a growing economy, sectors like FMCG and healthcare often shine during a slowdown. Knowing when to rotate your portfolio in or out of these sectors can dramatically improve long-term returns and reduce risk.
In this blog, we’ll dive into:
- How India’s market and economic cycles work,
- The key sectors that perform at each stage,
- Tools and indicators to spot the cycle early, and
- How smart investors can use this knowledge to time their entries, exits, and allocations more effectively.
Because the truth is simple: You don’t need to predict the future—you just need to read the cycle.
Phase I – Contraction & Trough: The Bottom of the Cycle
Every market cycle begins—and ends—with a downturn. In this contraction phase, economic activity slows sharply. Corporate profits shrink, unemployment rises, consumer spending drops, and business investments stall. For investors, this is often the most painful part of the cycle—but also the most important to understand.
India’s Most Recent Contraction: FY 2020–21
The COVID-19 pandemic caused India’s real GDP to shrink by –5.8% in FY 2020–21—the sharpest contraction in decades. Lockdowns froze consumption, disrupted supply chains, and stalled industrial output. Unemployment spiked, and consumer sentiment hit record lows.
At the same time, inflation remained relatively high (averaging ~6.2% in 2020), further pressuring household spending. The RBI slashed repo rates aggressively to stimulate demand, but recovery took time.
What Happens to Sectors During This Phase?
In a contraction or recession, defensive sectors outperform. These are industries whose demand doesn’t fall significantly even during economic stress. They provide essential goods and services, making them resilient.
| Outperformers (Defensive) | Underperformers (Cyclical) |
|---|---|
| Healthcare (Pharma) | Auto, Capital Goods |
| FMCG/Consumer Staples | Real Estate |
| Utilities (Power, Gas) | Metals, Oil & Gas |
| Telecom | Financials, Banks |
Example:
- In early 2020, Nifty Pharma was one of the few indices in green while broader indices like Nifty Auto and Nifty Bank fell by 30–40%.
- FMCG stocks like Hindustan Unilever and Nestlé India outperformed due to steady consumer demand for essentials.
Key Characteristics of This Phase
- GDP growth turns negative or flat
- Earnings growth slows across sectors
- Interest rates often fall (as RBI cuts rates)
- Stock markets bottom out after steep declines
- Investor sentiment is extremely negative (“fear zone”)
What Should Investors Do?
- Focus on capital preservation, not aggressive returns.
- Allocate more to defensive sectors or low-volatility funds.
- Avoid chasing high-beta stocks or cyclical themes.
- Watch for early signs of recovery—they often begin before the broader economy turns.
Phase II – Recovery & Early Expansion: The Turning Point
After a period of contraction, the economy begins to stabilize. This recovery phase is the most subtle but crucial shift in the market cycle. While news headlines may still be gloomy and data weak, early signals of improvement start to emerge—for those paying close attention.
This is the phase where long-term investors can find the best opportunities. Stock markets usually bottom before the economy fully recovers, making it the ideal time to accumulate high-potential sectors.
India’s Recent Recovery: FY 2021–22
Following the COVID-led recession, India’s economy made a sharp comeback:
- Real GDP surged to 9.7% in FY 2021–22 .
- Government launched large-scale reforms, such as PLI (Production-Linked Incentives), infrastructure push, and credit support for MSMEs.
- RBI maintained a low interest rate regime, improving liquidity and consumption.
- PMI (Purchasing Managers’ Index) readings began rising steadily, signaling a pickup in manufacturing and services.
Despite ongoing health concerns and supply-chain issues, investor sentiment started turning positive—and stock markets rallied well ahead of GDP growth.
Sector Behavior in Early Expansion
As growth rebounds and liquidity remains high, investors begin rotating out of defensive sectors and into cyclical and rate-sensitive sectors.
| Sectors That Outperform | Sectors That Lag |
|---|---|
| Capital Goods & Infrastructure | FMCG, Utilities |
| Auto & Ancillaries | Pharma (post-COVID drag) |
| Banks & NBFCs (Credit growth) | Gold |
| Real Estate | Telecom |
Example:
- In 2021, Nifty Bank rose ~32% and Nifty Auto gained ~19%, outperforming defensive peers.
- Capital goods companies like L&T and realty stocks saw sharp rallies as capex and demand revived.
Key Characteristics of This Phase
- GDP growth rebounds sharply (V-shaped or U-shaped recovery)
- Corporate earnings recover
- Credit growth, IIP (Index of Industrial Production), and PMI start rising
- Investor confidence returns; FII inflows pick up
- Low inflation + low interest rates = ideal environment for business
What Should Investors Do?
- Increase allocation to cyclical and growth sectors
- Start rotating out of defensives (like FMCG, pharma) and into financials, autos, capital goods
- Invest in mid-caps and small-caps (which benefit early in recoveries)
- Look for stocks with earnings momentum and improving fundamentals
This phase is where smart positioning creates long-term wealth. Buying early into sectors that will lead the next growth wave can deliver multi-year compounding returns.
Phase III – Mid-Expansion: The Growth Engine at Full Speed
The mid-expansion phase is when the economy is firing on all cylinders. Consumer confidence is high, corporate earnings are growing consistently, and most sectors are performing well. This phase usually lasts the longest and offers broad-based investment opportunities across the market.
By now, the recovery is visible in real data—not just in sentiment. Businesses invest more, job creation picks up, and consumption accelerates. However, markets begin pricing in higher valuations, so stock selection becomes more important than just sector allocation.
India’s Mid-Expansion Phase: FY 2022–24
India’s post-pandemic rebound entered mid-expansion territory by FY 2022–23:
- GDP growth stabilized around 7.2–8.2% across FY 2022–24.
- PMI (Manufacturing) exceeded 55 consistently, and in July 2025 touched a 17-year high above 60.
- Corporate earnings improved across sectors, and tax collections hit record highs (GST above ₹1.6 lakh crore/month).
- Private CapEx saw a revival, with government-led infrastructure spending acting as a catalyst.
This environment supported strong rallies in capital goods, infra, IT, manufacturing, and mid-cap stocks.
Sector Behavior in Mid-Expansion
With both consumption and investment cycles active, almost all sectors benefit—but some more than others:
| Sectors That Outperform | Sectors That Begin to Cool Off |
|---|---|
| Capital Goods & Infra | FMCG (valuation peak) |
| Technology & IT Services | Pharma (post-COVID slowdown) |
| Consumer Discretionary (Retail, Auto) | Gold, Utilities |
| Industrials & Manufacturing | Defensive sectors generally lag |
Example:
- Nifty Infrastructure Index grew over 35% from 2022 to mid-2024.
- IT stocks like TCS, Infosys, and L&T Tech saw significant rerating as global demand returned.
- Midcap 100 index outperformed the large-cap index in this phase, as risk appetite increased.
Key Characteristics of This Phase
- Stable GDP growth (~6–8%)
- Low unemployment, rising wage growth
- Credit growth accelerates; NBFCs and banks see rising loan books
- RBI may begin cautious tightening (rate hikes) to manage inflation
- FII & DII inflows are strong, IPOs increase, market sentiment is bullish
What Should Investors Do?
- Continue exposure to cyclical sectors but begin being valuation-sensitive
- Focus on quality midcaps with strong earnings and scalable models
- Rebalance portfolios gradually—don’t chase momentum blindly
- Watch for signs of overheating (inflation spikes, rate hikes, debt build-up)
Mid-expansion is a phase of maximum optimism—but also rising risk. Staying disciplined with asset allocation, sector rotation, and exit planning becomes crucial as the market inches closer to its peak.
Phase IV – Late Expansion / Peak: The Tipping Point
As the market cycle matures, the economy enters its late expansion phase. On the surface, everything still looks strong—GDP growth is stable, corporate profits remain high, and markets may be at record levels. But beneath the optimism, early cracks start to appear.
This is when the economy is operating near full capacity. Inflation begins creeping up, the RBI may raise interest rates to cool demand, and asset prices—especially stocks—start getting expensive. While investors still see gains, the risk-reward balance begins to tilt.
India’s Ongoing Peak Phase: FY 2024–25 (Current Environment)
As of mid-2025, India seems to be nearing or already in the peak phase:
- GDP growth is projected at 6.5%, down from 8.2% the year prior.
- RBI has raised repo rates multiple times since 2023 to control sticky inflation (~5.4%).
- Valuations across sectors—especially FMCG, large-cap IT, and private banks—are above long-term averages.
- The stock market is near all-time highs, but IPOs are facing mixed responses and mid-caps are showing signs of volatility.
Economic growth is still solid, but concerns about global slowdown, oil prices, monsoon variability, and rate hikes are building.
Sector Behavior in Late Expansion
In this phase, investors become more cautious. Capital-intensive sectors begin to slow, while defensive and high-margin businesses come back into favour.
| Sectors That Outperform | Sectors That Start to Struggle |
|---|---|
| FMCG & Consumer Staples | Capital Goods, Infra (cost overruns) |
| Pharma & Healthcare | Realty, Auto (demand saturation) |
| IT Services (defensive large-caps) | Small-cap cyclicals |
| Gold (as hedge) | NBFCs (rising borrowing cost) |
Example:
- In late 2023 and 2024, IT majors and FMCG giants like HUL and Dabur saw renewed buying as investors sought earnings stability.
- Capital goods stocks that had run up sharply began consolidating due to rising input costs and interest rate pressures.
Key Characteristics of This Phase
- GDP stabilizes but begins to decelerate
- Inflation rises above comfort zone
- RBI tightens policy (rate hikes, liquidity squeeze)
- Corporate margins come under pressure
- Stock market shows signs of topping out—volatility rises, valuations rich
What Should Investors Do?
- Reduce exposure to high-beta and overvalued sectors
- Begin reallocating toward defensive stocks and quality dividend plays
- Focus on balance sheet strength and cash flow stability
- Avoid fresh investments in sectors nearing saturation or capacity peak
- Be watchful of global macro cues (US Fed, oil prices, geopolitical tensions)
This is not the time to be greedy. It’s the phase where markets test discipline—and those who stay cautious avoid the sharp corrections that often follow.
Spotting the Cycle: Indicators Investors Should Watch
Successfully navigating market cycles isn’t about predicting the future—it’s about reading the signs in real time. Market and economic phases rarely announce themselves, but certain leading and lagging indicators can help investors understand where we are in the cycle and adjust strategies accordingly.
By tracking the right mix of macroeconomic data, sectoral performance, and market sentiment, investors can make more informed, cycle-aware decisions.
Leading Indicators (Predictive Tools)
These indicators move ahead of the economic cycle and can help forecast the direction of the economy and markets:
| Indicator | Why It Matters |
|---|---|
| PMI (Purchasing Managers’ Index) | Signals manufacturing and services activity. A PMI above 50 suggests expansion. India’s July 2025 PMI hit a 17-year high, indicating robust growth. |
| Credit Growth / Bank Lending | Rising credit demand signals business and consumer confidence. Watch for trends in loan disbursals by banks and NBFCs. |
| IIP (Index of Industrial Production) | Measures output in manufacturing, mining, electricity. A rising IIP = industrial rebound. |
| Core Sector Output | Covers 8 industries (coal, crude, steel, etc.)—strong performance here precedes GDP growth. |
| Market Breadth & Advance-Decline Ratios | Positive breadth (more stocks rising than falling) often signals an early-stage bull cycle. |
Lagging Indicators (Confirmation Tools)
These indicators confirm trends after the economic cycle has shifted:
| Indicator | Why It Confirms Trends |
|---|---|
| Corporate Earnings Growth | Reflects improved demand and profitability—but appears after recovery has begun. |
| Inflation (CPI/WPI) | Peaks after the economy overheats. Rising inflation is often a sign of late-cycle activity. |
| Unemployment Rate | Improves after recovery is well underway. |
| GDP Growth Reports (Q-o-Q / Y-o-Y) | Important, but backward-looking. |
| Interest Rate Decisions | RBI actions often come after inflation or overheating is visible in data. |
Market Sentiment Indicators
| Indicator | Interpretation |
|---|---|
| FII/DII Flows | FIIs are typically early movers. High inflows = confidence in expansion phase; sharp outflows may hint at peak/slowdown. |
| Volatility Index (India VIX) | Low VIX often means complacency (late expansion), while high VIX signals fear (bottoming phase). |
| IPO Market Activity | A surge in IPOs usually reflects late-stage optimism. Poor listings indicate a turning point. |
Tools & Data Sources Indian Investors Can Use
- RBI Bulletin & MPC Minutes – interest rates, credit trends
- MoSPI – GDP, IIP, inflation data
- NSO (National Statistical Office) – unemployment, economic surveys
- NSE/BSE Market Breadth Tools
- Bloomberg/TradingView/Moneycontrol – sector rotation, FII flows, PMI charts
No single indicator gives a full picture. But by tracking 4–5 of them in combination, investors can build a mental model of the cycle—and rotate portfolios accordingly.
How Investors Can Use the Cycle Strategically
Understanding the market and economic cycle is powerful—but acting on it strategically is what drives returns. Once you can recognize which phase we’re in, you can tailor your portfolio to optimize for growth, manage risk, and avoid costly mistakes.
Tailor Asset Allocation to the Cycle
Adjust your equity, debt, and gold exposure based on the economic phase:
| Phase | Equity | Debt | Gold |
|---|---|---|---|
| Contraction | ↓ (Defensive) | ↑ (Safer bonds) | ↑ (Hedge against fear) |
| Recovery | ↑ (Cyclicals, midcaps) | → (Neutral) | ↓ |
| Expansion | ↑↑ (Broad equities) | ↓ (Rising rates hurt bonds) | → |
| Peak | ↓ (Selective large-caps) | ↑ (Short-term debt) | ↑ (Volatility hedge) |
Use Sector Rotation to Stay Ahead
Rotate your exposure in sync with the phase. Here’s a cheat sheet:
| Cycle Phase | Preferred Sectors |
|---|---|
| Contraction | FMCG, Healthcare, Utilities |
| Recovery | Banking, Auto, Real Estate, Infra |
| Mid-Expansion | Capital Goods, IT, Consumer Discretionary |
| Peak | FMCG, Pharma, Gold, Export-Oriented Businesses |
✅ Tip: Look for sectoral leadership changes on the Nifty indices to anticipate rotations early.
Focus on Earnings and Valuations
- In recovery, bet on quality midcaps with turnaround stories.
- In expansion, back companies with strong growth and reasonable valuations.
- In peak, shift toward margin stability and dividend yield.
RBI policy, liquidity flows, and interest rate trends also offer valuable signals—rising rates hurt high-debt sectors, while easing supports growth. Keep rebalancing your portfolio quarterly to adjust for market phase, avoid overexposure, and maintain discipline. Finally, stay grounded—buy when fear is high, and trim when markets are euphoric.
Conclusion: Ride the Cycle, Don’t Chase It
Market and economic cycles are inevitable. While their timing can vary, their patterns repeat—bringing predictable shifts in sector performance, investor behavior, and market sentiment. For Indian investors, understanding these cycles isn’t about timing the exact top or bottom; it’s about recognizing the phase and positioning accordingly.
By aligning your asset allocation, sector exposure, and risk strategy with the stage of the cycle, you can reduce drawdowns, capture growth early, and avoid emotional decisions. From defensives during downturns to cyclicals during recoveries, every phase presents opportunities—for those who know where to look.
In investing, knowledge is an edge—and cycle awareness is one of the sharpest tools you can carry.
FAQs – Market Cycle in India
What is a market cycle?
A market cycle is the natural rise and fall of stock markets driven by economic activity, investor sentiment, and business performance.
How does the economic cycle affect the stock market?
Each phase of the economy—expansion, peak, contraction, recovery—impacts sector performance, valuations, and investment returns.
What are the four main phases of a market cycle?
The four phases are expansion, peak, contraction (or recession), and recovery.
Which sectors perform well in a slowdown?
Defensive sectors like FMCG, healthcare, and utilities usually perform better during economic slowdowns.
When do cyclical sectors perform best?
Cyclical sectors like auto, capital goods, and banking do well during recovery and early expansion phases.
How can I spot where we are in the cycle?
Track indicators like GDP growth, PMI, credit expansion, inflation, and RBI rate policies.
Is it possible to time the market using cycles?
Not perfectly—but aligning your strategy with the cycle can improve returns and reduce risk.
What mistakes do investors make during late-cycle peaks?
They often chase overvalued sectors and ignore early warning signs like rising inflation or interest rates.
Should I invest in small-caps during recovery?
Yes, quality small- and mid-cap stocks tend to outperform early in the recovery phase.
How often should I rebalance my portfolio?
Review and rebalance every quarter to stay aligned with market phase and valuation shifts.
Related Articles
How a Tea Seller Used the Power of Compound Interest to Build ₹45 Lakh
China’s Fertilizer Export Halt to India: Stocks Set to Gain from the Supply Shock
The 15-15-15 Rule: Why the ₹1 Crore SIP Dream Needs a Reality Check