
Introduction: Why Stock Market Indicators Matter
For beginners, navigating the stock market can be overwhelming. With thousands of stocks moving every day, how do you determine which ones are worth investing in? The answer lies in stock market indicators—tools that help investors analyze price trends, momentum, and overall market conditions.
In this guide, we will explore the top 5 key indicators in the stock market, explaining what they are, how they work, and how you can use them to make informed investment decisions.
1. Moving Averages (MA)
What is a Moving Average?
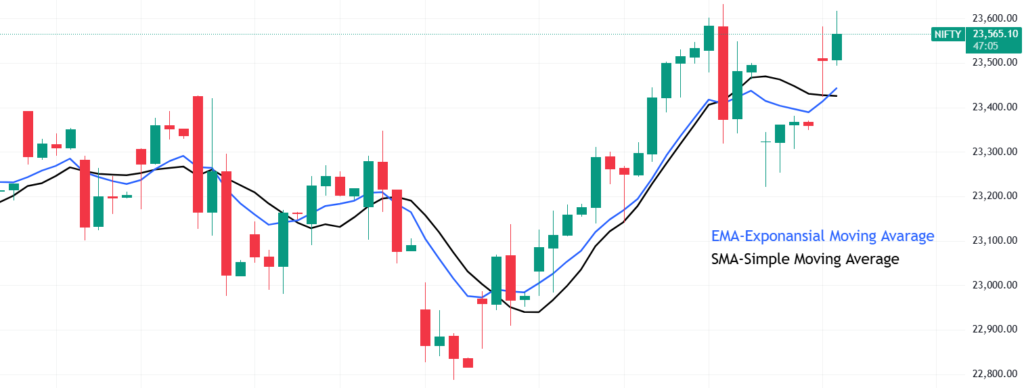
A Moving Average (MA) smooths out price fluctuations over a specific period to help identify trends. It calculates the average closing prices of a stock over a set timeframe, such as 50 days or 200 days.
Types of Moving Averages:
- Simple Moving Average (SMA): A basic average of closing prices over a selected period.
- Exponential Moving Average (EMA): Gives more weight to recent prices, making it more responsive to new data.
How to Use Moving Averages?
- When a stock price is above the 50-day or 200-day moving average, it signals an uptrend.
- When a stock price is below the moving average, it indicates a downtrend.
- A Golden Cross (when a short-term MA crosses above a long-term MA) is a bullish signal.
- A Death Cross (when a short-term MA crosses below a long-term MA) is a bearish signal.
Example:
If Reliance Industries’ 50-day moving average is ₹2,500, but the stock trades at ₹2,700, it confirms a strong upward trend.
2. Relative Strength Index (RSI)
What is RSI?
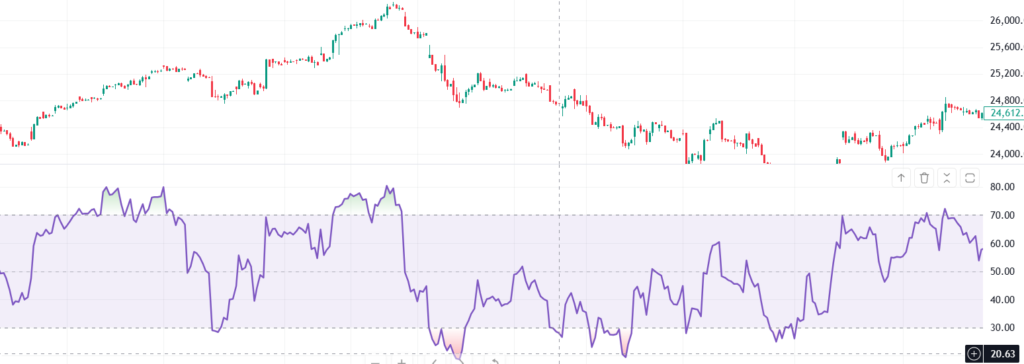
The Relative Strength Index (RSI) is a momentum indicator that measures whether a stock is overbought or oversold.
How RSI is Calculated?
RSI is measured on a scale of 0 to 100:
- Above 70: Stock is overbought and may face a correction.
- Below 30: Stock is oversold and may see a rebound.
How to Use RSI?
- Buy Signal: When RSI moves from below 30 to above 30, it suggests a potential uptrend.
- Sell Signal: When RSI moves from above 70 to below 70, it may indicate a downward trend.
Example:
If Infosys’ RSI is at 25, it means the stock is oversold and may bounce back soon.
3. Bollinger Bands
What are Bollinger Bands?
Bollinger Bands consist of three lines:
- Middle Band: 20-day moving average.
- Upper Band: Two standard deviations above the moving average.
- Lower Band: Two standard deviations below the moving average.

How to Use Bollinger Bands?
- When the stock price touches the upper band, it may be overbought.
- When the stock price touches the lower band, it may be oversold.
- A narrowing of bands indicates low volatility, while widening of bands signals high volatility.
Example:
If HDFC Bank’s stock price touches the lower band, it might be a good buying opportunity.
4. MACD (Moving Average Convergence Divergence)
What is MACD?
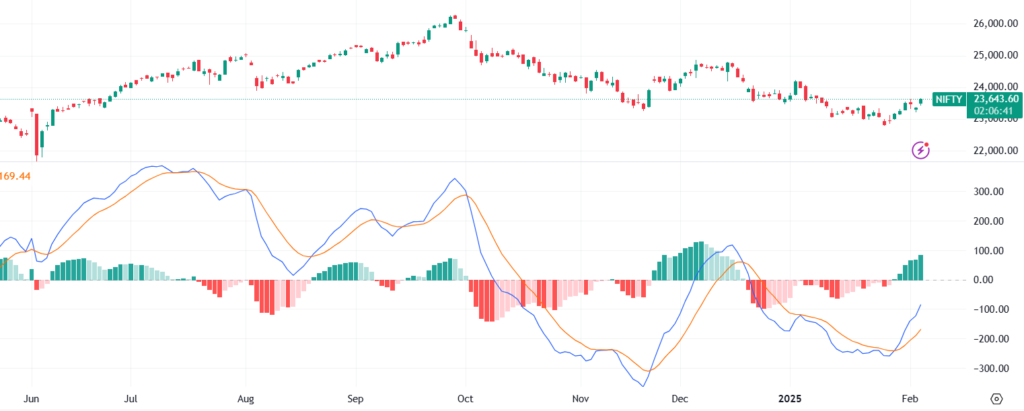
The MACD indicator helps identify changes in trend momentum by comparing two moving averages.
Components of MACD:
- MACD Line: Difference between 12-day and 26-day EMAs.
- Signal Line: 9-day EMA of the MACD line.
- Histogram: Difference between MACD and Signal Line.
How to Use MACD?
- Bullish Signal: When the MACD line crosses above the Signal line.
- Bearish Signal: When the MACD line crosses below the Signal line.
Example:
If TCS’s MACD crosses above the Signal line, it could be a sign of an upcoming price rally.
5. Volume Indicator (Trading Volume Bars)
What is Trading Volume?
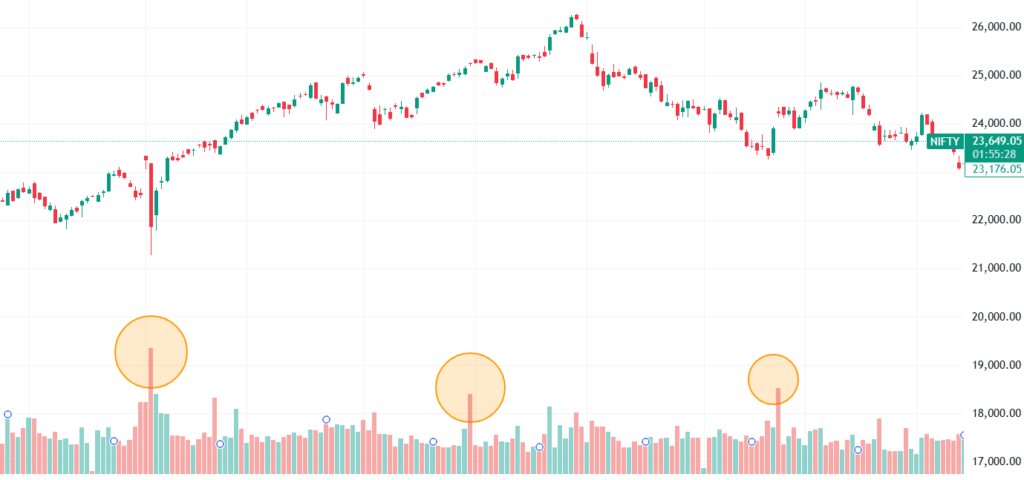
Trading volume refers to the number of shares bought and sold within a specific time period. It is represented as bars at the bottom of stock charts, with taller bars indicating higher trading activity.
How Trading Volume Works?
- High volume during an uptrend confirms strong buying interest.
- High volume during a downtrend signals increased selling pressure.
- Low volume may indicate weak momentum or indecision in the market.
How to Use Trading Volume Bars?
- If a stock’s price rises with high volume, it suggests a strong bullish trend.
- If a stock’s price rises with low volume, the move may be weak and unsustainable.
- Volume spikes often precede major price movements, acting as an early indicator.
Example:
If Infosys stock shows a sudden volume spike along with a price breakout, it may indicate strong investor interest and potential upward momentum.
Conclusion: Mastering Stock Market Indicators for Smarter Investing
Understanding these five key indicators can help beginners make more informed investment decisions. No single indicator guarantees profits, but combining them provides a clearer market picture.
Practice using these indicators on platforms like TradingView, and Broker Account to develop confidence in stock analysis.
FAQs
1. Which stock indicator is best for beginners?
Moving Averages and RSI are the easiest to understand and widely used.
2. Can I use multiple indicators together?
Yes! Combining indicators provides stronger trading signals.
3. How often should I check stock indicators?
It depends on your trading style—daily for short-term traders, weekly/monthly for long-term investors.
4. Where can I track these indicators?
You can monitor stock indicators on platforms like TradingView, NSE India, and Moneycontrol.
5. Do indicators guarantee accurate predictions?
No, indicators help in analysis, but stock prices are influenced by multiple factors.