Introduction
Every few months, the stock market kicks into high drama mode — it’s earnings season again.
Stocks surge, headlines scream “Earnings Beat,” and social media turns into a playground of hot takes and predictions.
Retail traders often jump in after the move, hoping to ride the momentum.
But by then, smart money has already placed its bets — or exited with profits.
Let’s be honest: if you’ve ever bought a stock just after it jumped 10% on earnings, only to see it fall the next day, you’re not alone.
I’ve made that mistake too. It stings.
This blog covers two powerful ideas that could transform how you trade around earnings:
- Why retail investors lose money after results — even when the numbers look great
- How you can spot stock setups before the earnings drop using real, simple indicators
We’ll go through actual market examples, explore trading psychology, and look at data-driven signals like volume spikes, RSI breakouts, and option chain behavior — all things that pros use while most retail traders watch from the sidelines.
If you’ve ever felt late to a move or stuck in a post-earnings trap, this blog will help you flip that script.
Let’s start by exposing the biggest mistake retail investors make during earnings season — and how to avoid it.
Why Retail Investors Often Lose After Earnings
Earnings season triggers a rush of excitement. Stocks move fast, and the news comes in even faster.
But here’s where most retail traders go wrong — they chase the result, not the setup.
Let’s say a company reports strong numbers — EPS beats estimates, revenue looks solid, and management sounds confident on the call.
Within minutes, the stock gaps up 8–10%. Telegram groups light up. Twitter floods with “still early” calls. And by the time you hit buy, you’re entering after the move — not before it.
What happens next?
Institutions, who bought quietly weeks earlier, start booking profits. The stock cools off. And the candle that looked green at 9:30 am?
It closes red by 3:15 pm.
It’s not that the company disappointed — the mistake is buying after the crowd already reacted.
Let’s take a real example.
Case Example: Zomato Q2 Earnings Trap
Zomato reported earnings that beat estimates on revenue growth. The stock gapped up at the open with 20 million shares traded in the first hour.
But here’s the trap —
The price couldn’t hold above the opening high. Intraday sellers stepped in, and by the end of the day, the stock gave up most of its gains.
Retail traders who bought after the spike got trapped.
The volume was real. The result looked good.
But the move? It was already priced in.
Emotional Triggers That Cause These Mistakes
You’re not just trading numbers during earnings — you’re also trading emotion. And markets prey on that.
Here’s what usually happens:
- Before the result: “Let me wait and see. Too risky.”
- After the gap-up: “I knew it! Should’ve bought earlier.”
- Mid-day: “It’s still going! Let me grab some.”
- Next day: “Why is it falling now? What did I miss?”
It’s a cycle powered by FOMO (fear of missing out). And once FOMO takes over, rational thinking fades.
The irony? Most of the real gains happen before the earnings release — not after.
That’s what the next section is all about: spotting the signs before the crowd reacts.
How to Predict Stock Moves Before Quarterly Results
While most traders focus on the numbers after earnings, experienced investors read the signs before results.
These pre-result indicators aren’t hidden secrets — they show up on charts, delivery data, and even the options market.
Let’s break down the exact signals using real examples from the Q4 2024 earnings season.
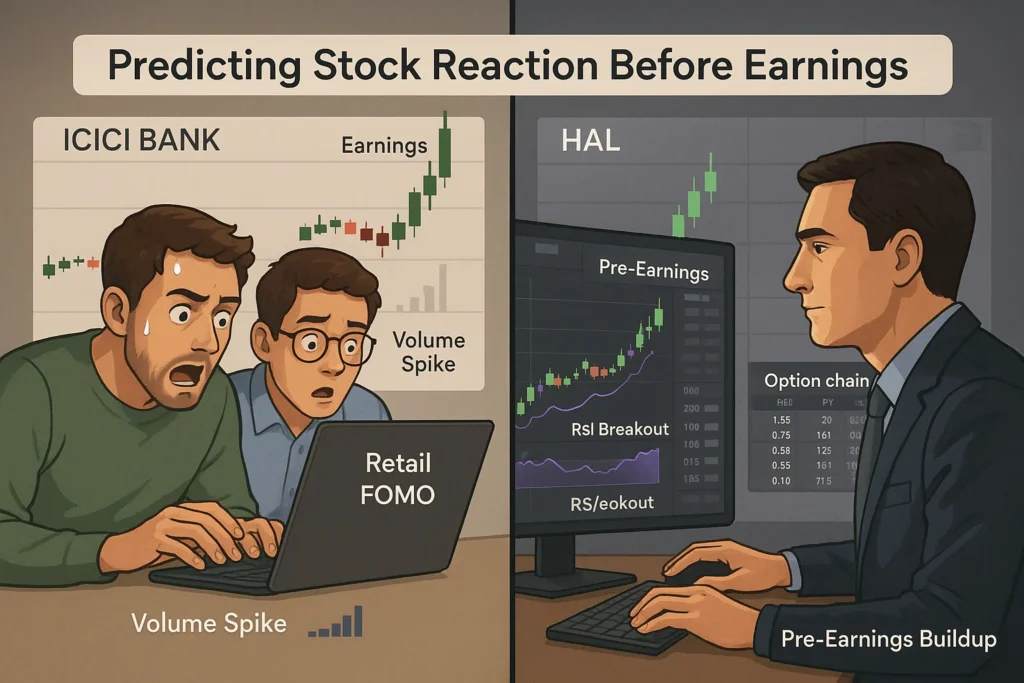
1. Option Chain Clues: ICICI Bank (April 2024)
ICICI Bank’s Q4 results were due on Saturday, April 27, 2024.
In the week leading up to it, something interesting was brewing in the options market.
What we saw:
- The stock hovered around ₹1,080–₹1,100.
- Aggressive Put writing emerged at ₹1,080 and ₹1,100.
- Open Interest in Out-of-the-Money Calls at ₹1,120 and ₹1,140 surged.
What does this mean?
Put writers believed the stock wouldn’t fall — they were building a floor.
At the same time, call buyers were positioning for a breakout above ₹1,120.
This was a setup. Not a reaction.
And what happened next?
- On Monday, April 29, the stock opened at ₹1,155, well above the expected range.
- It touched a high of ₹1,162, delivering instant gains to those who positioned early.
Lesson:
Watch for Put writing at key supports and Call Open Interest buildup above the price.
That’s often where institutions place their bets quietly, before the crowd catches on.
2. RSI Breakouts with Price Momentum: HAL (April–May 2024)
While ICICI showed signs in the derivatives data, HAL’s setup was visible on the charts.
In the weeks before its results (announced May 16), HAL showed:
- A steady uptrend
- RSI consistently above 70, even touching 80+ several times
- Price climbing rapidly on strong volume
Many traders wrongly assume RSI above 70 means “overbought.”
But when it stays high — especially in trending stocks — it’s a signal of strong momentum, not exhaustion.
Post-result?
- HAL posted a 52% YoY rise in net profit.
- The stock, already at ₹4,500, shot past ₹5,400 within two weeks.
That’s nearly a 20% move after a strong pre-result signal.
Lesson:
Don’t fear high RSI in trending stocks — if it holds above 70 and price makes higher highs, momentum is on your side.
3. Delivery Volume: Silent Accumulation
Though less dramatic, delivery volume quietly reveals whether serious buyers are stepping in.
Let’s return to ICICI Bank:
In the 4–5 sessions before results, delivery volume hovered between 55–60% of total traded volume —
well above average for a liquid large-cap stock.
This meant:
- Buyers were not just trading intraday — they were taking delivery, holding ahead of the announcement.
While not always a solo signal, when delivery volume rises along with price stability or breakout, it confirms smart money positioning.
Lesson:
Look for 2–3 days of above-average delivery percentage before results — especially in large caps with institutional interest.
Bringing It Together: How You Can Use These Signals
Now, let’s tie these lessons into a practical approach:
| Signal | What to Look For | Why It Matters |
|---|---|---|
| Option Chain Setup | Put writing at key supports, OTM Call OI buildup | Shows market confidence, hints at breakout |
| RSI Breakout | RSI >70 holding + Price in uptrend | Momentum is strong, pre-result rally likely |
| Delivery Volume | 2–3 days of rising delivery percentage + price rise | Indicates accumulation by long-term players |
You don’t need to predict the result itself.
You just need to understand how the market is positioning — and align with it before the news drops.
A Smarter Approach: Predicting Stock Moves Without Guessing Results
Earnings seasons are noisy. Headlines fly in, brokerages update targets, and retail traders often get trapped chasing spikes after the event.
But what separates seasoned traders from the rest is this:
They never wait for the news — they read the signs and position in advance.
Let’s build a simple framework using everything we’ve learned:
Step 1: Identify Upcoming Earnings Events
Start with a basic earnings calendar:
- Filter for Nifty 50 and popular midcaps
- Look 7–10 days ahead
- Make a watchlist of 5–7 stocks
- Popular sources: Stock Exchange Websites
- BSE India
- NSE India
- Financial Portals & Apps
- Moneycontrol
- Screener.in
- Trendlyne
- Broker apps like Zerodha, Upstox, Groww, etc.
Step 2: Check for Pre-Result Buildup
In the week leading up to earnings, observe:
✅ Option Chain Activity
- Are Put options seeing writing (OI increase) near current price?
- Are Call options being bought at higher strikes (OTM)?
- Is implied volatility rising?
If yes, the stock is being positioned for — not against.
✅ RSI and Price Trend
- Is RSI above 60–65 and staying there?
- Is price breaking out of recent consolidation?
- Are the candles getting larger on the upside?
If yes, momentum traders are stepping in.
✅ Delivery Volume
- Is delivery % rising for 2–3 sessions?
- Is this happening on flat or slightly up days?
If yes, buyers are accumulating before the news.
Step 3: Avoid the FOMO Trap
After the result is announced, this is what usually happens:
- Retail rushes in on the breakout candle
- The stock pulls back or consolidates, punishing late entries
- Smart money exits while new buyers take the hit
This is why volume traps and post-result selloffs are so common — not because the stock is bad, but because the move already happened.
Rule of thumb:
If you didn’t see the stock before the result, don’t chase it after.
Step 4: Trade the Setup — Not the Result
You don’t need to know whether earnings will beat or miss.
You just need to:
- Read what the market is doing before the result
- Enter with a clear stop-loss and defined target
- Exit quickly after the reaction plays out (1–3 days)
This method avoids gambling on the earnings number. Instead, it leverages positioning data, which is often more accurate than analyst forecasts.
Final Thoughts: From Guessing to Positioning
Most retail traders act on emotions — excitement after a breakout, fear after a dip.
The path to profitability lies in studying the buildup, not reacting to the news.
Let’s recap the key ideas:
- Volume, RSI, and Option Chain give early clues before earnings
- Stocks often move before the results, not after
- Post-result spikes are often traps, not opportunities
- Focus on structure and positioning, not predictions
If you study this setup consistently — even just during quarterly results — you’ll begin to trade with confidence, not confusion.
It’s not magic. It’s just market behaviour — and now, you know how to read it.
Related Articles:
China’s Fertilizer Export Halt to India: Stocks Set to Gain from the Supply Shock
DRDO’s Emergency Weapon Orders: Defence Stocks Set to Gain
Insider Buying in Indian Stocks: Hidden Signals You Shouldn’t Ignore
More Articles
How to Transfer Shares from Groww to Zerodha – Full Guide (2025)
Why Fundamentals Are Failing—and Market Cycles Are Getting Shorter
How a Tea Seller Used the Power of Compound Interest to Build ₹45 Lakh