Market Outlook:
The Market Outlook for 11 July shows a mixed picture across Indian indices. While benchmark indices like Nifty 50 and Sensex declined from recent highs, smallcaps continued to show resilience. The Nifty 50 slipped 123 points to close at 25,353.05 (-0.48%), and the Sensex fell 381 points to 83,154.16 (-0.46%) amid weak global cues and profit booking in heavyweight sectors.

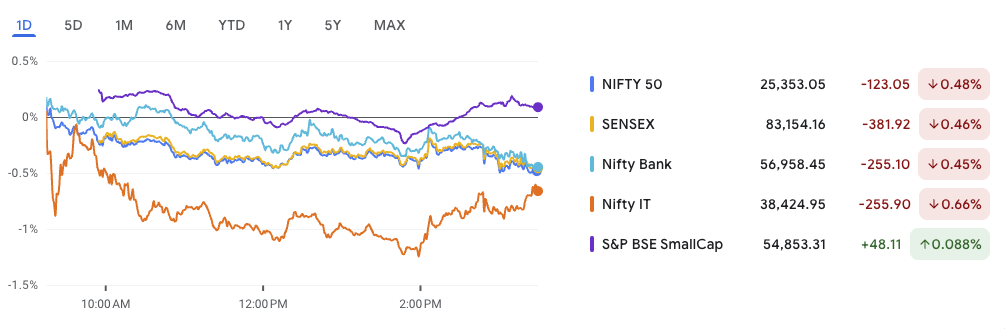
Banking and IT stocks remained under pressure, with Bank Nifty down 0.45% and Nifty IT falling 0.66%. However, the real story in the Market Outlook 11 July is the steady uptrend in smallcaps. The S&P BSE SmallCap Index edged up 0.088%, extending its recent outperformance and highlighting growing investor interest in broader market opportunities.
This edition of the newsletter brings you:
- A technical outlook on Nifty 50 and key levels to watch
- Why Smallcaps Surge continues despite largecap fatigue
- A breakdown of the day’s top news and impacted stocks
- Our stock on the radar for a potential breakout
- Fresh IPO GMP updates with expected listing gains
- A closer look at a high-quality smallcap in focus today
Stay with us as we break down what’s driving the action—and where it could head next.
Nifty Outlook – Market Outlook 11 July
The Nifty 50 Index ended lower at ₹25,355.25, down 120.85 points (-0.47%), signaling a continuation of the recent rangebound movement. With volume at 219.61 million—below average—the market seems to be pausing after a strong June rally. As part of the Market Outlook 11 July, this consolidation phase becomes important to monitor for either a bullish breakout or a short-term correction.

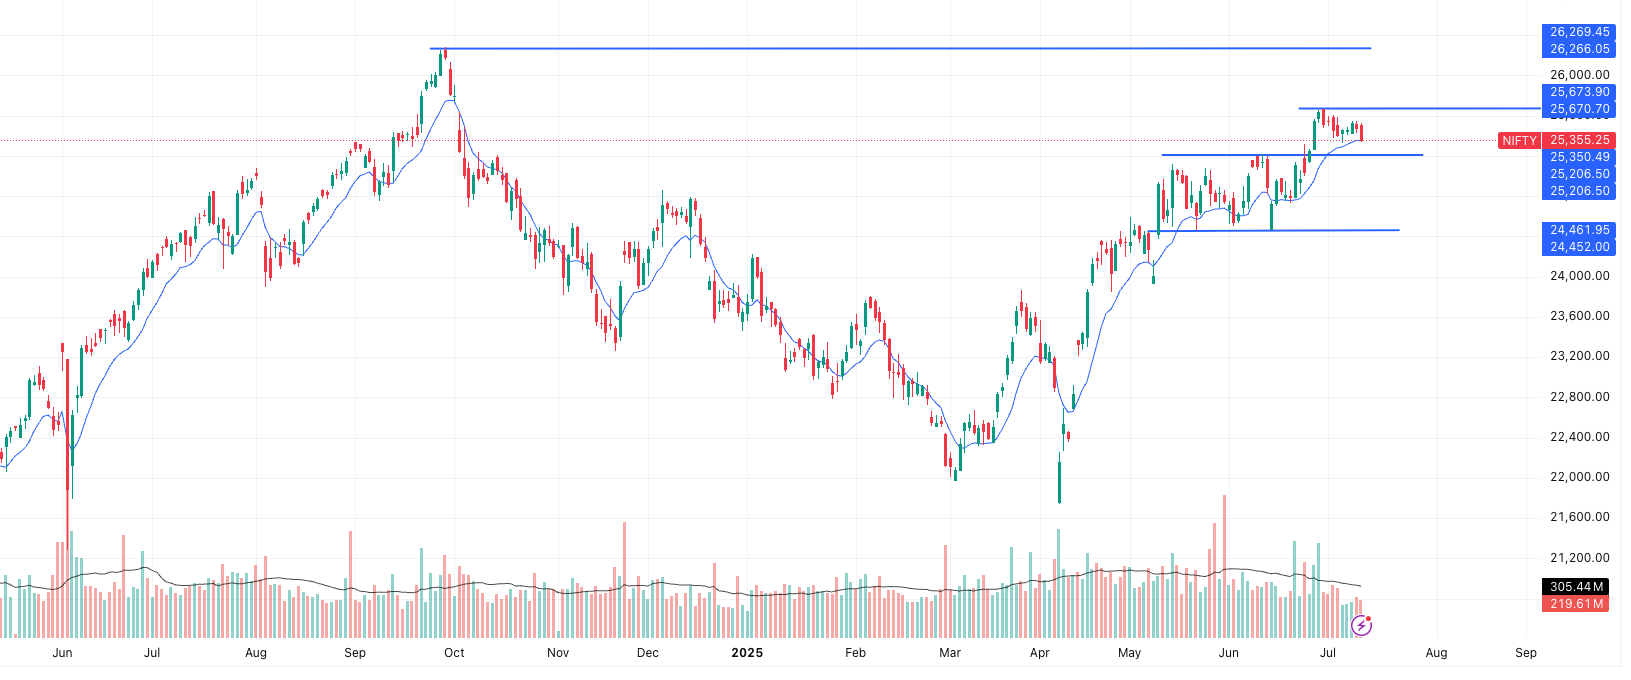
1. Support and Resistance Levels
Support Zones:
- Support 1: ₹25,206 – ₹25,206.50
This level acted as the breakout point during the early June rally. It’s also aligned with the 9-day EMA, offering dynamic support in the short term. A sustained hold above this level keeps the trend intact. - Support 2: ₹24,452 – ₹24,462
A strong base built in late May. If the index breaks below ₹25,200 with volume, this level could act as a crucial demand zone and potential reversal point.
Resistance Zones:
- Resistance 1: ₹25,670 – ₹25,674
This is the immediate hurdle. The index has attempted to clear this range multiple times but failed, leading to sideways action. A decisive breakout is needed for momentum to pick up. - Resistance 2: ₹26,266 – ₹26,269.45
This all-time high zone remains the next upside target if ₹25,670 is crossed convincingly.
2. Pattern Formation – Bullish Flag / Range Consolidation
After June’s breakout, Nifty has entered a sideways range between ₹25,200 – ₹25,670. This resembles a bullish flag, often a continuation pattern that resolves higher after consolidation.
3. Volume and Momentum
Declining volumes suggest lack of aggressive selling, a typical feature of healthy consolidation. The index is still respecting its 9-day EMA, reinforcing short-term bullishness. However, a close below ₹25,200 with high volume could flip the trend.
4. Summary Table
| Aspect | Level/Zone | Interpretation |
|---|---|---|
| Immediate Support | ₹25,206 | Breakout zone; short-term trend defense |
| Major Support | ₹24,452 – ₹24,462 | Strong base; likely rebound area |
| Immediate Resistance | ₹25,670 – ₹25,674 | Flat resistance band; key breakout level |
| Swing Target | ₹26,260+ | Post-breakout objective |
| 9-day EMA | ₹25,350.49 | Short-term dynamic support |
| Volume Trend | Decreasing | Suggests accumulation and low selling pressure |
5. Trading Strategy
Bullish Setup:
- Entry above ₹25,670 on daily close with strong volume
- Targets: ₹26,000 and ₹26,260
- Stop-loss: Below ₹25,200
Bearish Setup:
- Breakdown entry below ₹25,200 with volume confirmation
- Target: ₹24,450 (gap fill and strong base)
- Stop-loss: Above ₹25,500
Conclusion
As highlighted in the Market Outlook 11 July, the Nifty 50 is forming a bullish consolidation between ₹25,200 and ₹25,670. A breakout above the upper band could resume the uptrend toward 26,260 and beyond. However, failure to hold above ₹25,200 may shift sentiment, bringing deeper supports into play. Keep an eye on volume to validate any breakout or breakdown.
News and Impacted Stocks – Market Outlook 11 July
In today’s Market Outlook 11 July, we take a closer look at key corporate events, regulatory developments, and macroeconomic movements that impacted Indian equities. Several stock-specific triggers, spanning IT earnings, global trade, government disinvestment plans, and Q-commerce disruption, drove market sentiment.
TCS Q1 Results – Mixed Performance Amid Weak Revenue Growth
Tata Consultancy Services (TCS) reported a 4% QoQ increase in net profit to ₹12,760 crore, narrowly beating estimates. However, sequential revenue declined 1.6% to ₹63,437 crore, below Bloomberg expectations. EBIT margins held steady at 24.5%.
- Key Data:
- Revenue: ₹63,437 Cr (vs ₹64,479 Cr previous quarter)
- EBIT: ₹15,514 Cr (down 1% QoQ)
- Net Profit: ₹12,760 Cr (up 4%)
- Total Contract Value: $9.4 billion (down from $12.2 billion)
The management attributed subdued performance to global macro uncertainties. Despite weaker topline, the market appreciated margin resilience and the healthy deal pipeline.
Impacted Stock:
TCS (NSE: TCS) – Expect rangebound trading until visibility on demand improves. Analysts may revise FY25 guidance marginally.
India–US Trade Talks Resume Amid Trump’s BRICS Tariff Warning
India is dispatching trade negotiators to Washington DC for renewed trade talks under the interim deal framework. This comes after a tariff pause deadline extension to Aug 1.
- Key Sticking Points: Agriculture, dairy, pharma access
- Backdrop: Trump’s warning of 10% tariffs on BRICS exports adds geopolitical tension
While optimism remains, meaningful breakthroughs may be difficult without compromise on both sides. Markets could react to any update on tariff relaxations in sensitive sectors like pharmaceuticals and tech components.
Impacted Sectors: Pharma, agriculture, auto ancillaries, chemicals
Market Outlook 11 July: Investors are advised to monitor any developments around tariff escalations and sectoral exemptions.
LIC Stake Sale Back on the Table
The government is considering a further stake sale in Life Insurance Corporation (LIC) via the OFS (Offer for Sale) route. The target is to reduce its holding by 6.5% to meet SEBI’s minimum public shareholding norm of 10% by 2027.
- Current Govt Stake: 96.5%
- IPO Sale (2022): 3.5% stake at ₹902–949
- Market Cap: ₹5.85 lakh crore
The potential sale, depending on market conditions, could be the largest disinvestment move of FY26. Retail and institutional investor demand will play a crucial role in price discovery.
Impacted Stock: LIC (NSE: LICI) – The news may create near-term pressure due to supply overhang, but long-term re-rating potential remains.
Ola Electric Hits New Low Amid Fresh Block Trade
Ola Electric Mobility shares declined 1.2% to ₹39.90 after a block trade of 1.29 million shares on BSE. This follows last month’s deal where Hyundai sold a 3.23% stake at ₹51.40.
- FY25 Q4 Net Loss: ₹870 crore
- Revenue/Deliveries: Down sharply
Sentiment remains weak amid poor financials and governance concerns. Any improvement in sales metrics or clarity on future fundraising could be a trigger.
Impacted Stock: Ola Electric (unlisted but traded in grey market) – Investors cautious due to declining valuations and mounting losses.
Q-Commerce Booms: Blinkit, Instamart Drive ₹64,000 Cr FY25 GOV
According to CareEdge Advisory, India’s quick-commerce segment doubled its Gross Order Value (GOV) to ₹64,000 crore in FY25 from ₹30,000 crore in FY24. The growth is expected to hit ₹2 lakh crore by FY28.
- Platform Revenues FY25: ₹10,500 crore
- Take Rate Growth: 18% (from 7–9% in FY22)
- Dark Stores in FY25: 3,072 (↑70%)
- Online Shoppers in India: 270 million
- Internet Users: 806 million
Focus has shifted from scale to profitability via:
- Subscriptions & ads
- Private labels
- Inventory tech
- Tier-2/3 expansion
Impacted Stocks/Platforms: Zomato (Blinkit), Swiggy Instamart, Zepto (unlisted) – These companies stand to benefit from the rapid formalisation and monetisation of the segment.
Market Outlook 11 July: Continued digital penetration and urban lifestyle shifts make this a structural growth trend.
Sindhu Trade Links Enters Lithium & Rare Earth Mining
Sindhu Trade Links Ltd announced a ₹833 crore investment plan to tap into lithium and rare earth element (REE) mining, both in India and globally. The move aligns with India’s National Critical Mineral Mission, a strategic push to secure domestic access to key green-tech inputs.
- Focus Areas: Lithium, REE, iron ore
- Investment Type: JVs and acquisitions
- Objective: Secure mineral value chain for clean energy, EVs, electronics
Impacted Stock: Sindhu Trade Links (NSE: SINDHUTRAD) – Positive sentiment expected as the company diversifies into a high-growth, strategic sector.
Emcure Pharma Surges on USFDA Clean Chit
Emcure Pharmaceuticals rallied after the USFDA concluded a successful PAI (Pre-Approval Inspection) at its oncology plant in Sanand without issuing any Form 483s.
- Stock Price: ₹1,286 (+2.28% intraday)
- YTD Performance: -11%
Clean inspections boost regulatory trust and fast-track product approvals, especially in the US oncology space. This may help Emcure recover some lost ground in valuations.
Impacted Stock: Emcure Pharmaceuticals (NSE: EMCURE) – Near-term bullish sentiment as regulatory overhang clears.
Conclusion – Market Outlook 11 July
Today’s developments underscore a complex environment where company-specific triggers, sectoral shifts, and global cues are all influencing market mood. As we head into the second half of July, results season, policy developments, and disinvestment news will shape index direction. Stay tuned for deeper insights in our upcoming editions.
Stocks on Technical Radar – Market Outlook 11 July
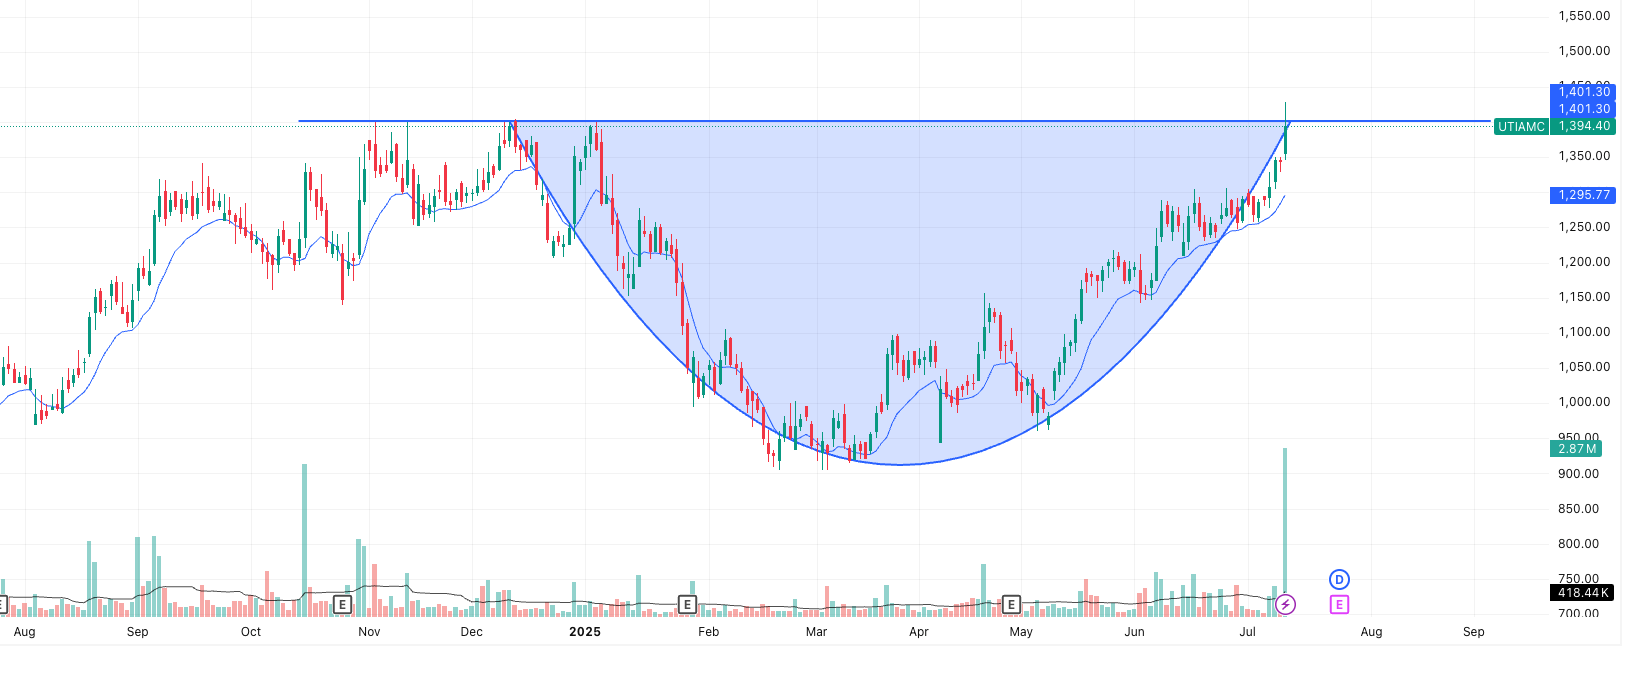
UTIAMC (UTI Asset Management Company Ltd.) – Breakout from Rounded Cup Pattern
Current Price: ₹1,394.40
Breakout Level: ₹1,401.30
Volume: 2.87 million (highest in months)
9-Day EMA: ₹1,295.77
1. Pattern Formation: Rounded Cup (Bullish Continuation)
UTIAMC has formed a rounded bottom pattern over several months, beginning in November 2024 and completing in early July 2025. The stock broke out above the neckline at ₹1,401.30, marking a bullish continuation setup with strong conviction.
Unlike a cup-and-handle, this breakout occurred without a handle, indicating immediate buyer momentum without consolidation pauses.
2. Breakout Target Calculation
- Cup Bottom: ~₹970
- Neckline (Resistance): ~₹1,401
- Cup Depth: ₹1,401 – ₹970 = ₹431
- Projected Target: ₹1,401 + ₹431 = ₹1,832
Swing Target Zone: ₹1,800 – ₹1,830 over the next 3–6 weeks.
3. Technical Strength Indicators
| Indicator | Observation |
|---|---|
| Breakout Candle | Strong green candle, closes near intraday high |
| Volume Surge | 2.87M – Highest in months (confirms buyer participation) |
| EMA(9) Position | ₹1,295.77 – Well below price, confirms strong trend |
| Resistance Cleared | Stock is now in fresh territory post-breakout |
The combination of large candle, high volume, and distance from EMA shows strength and trend momentum.
4. Swing Trading Plan
| Action | Price Zone |
|---|---|
| Entry | ₹1,380 – ₹1,395 (on retest or dips) |
| Stop Loss | ₹1,295 (below EMA and breakout line) |
| Target 1 | ₹1,500 (psychological round level) |
| Target 2 | ₹1,675 (mid-point of move) |
| Target 3 | ₹1,830 (full breakout target) |
This setup offers a risk/reward ratio of 1:4+, making it a high-probability trade for swing traders.
5. Caution Signals to Watch
- A close below ₹1,350 may suggest a false breakout.
- Lack of follow-up volume in the next 2–3 sessions could stall momentum.
- Broader index weakness (as covered in the Market Outlook 11 July) may delay the upside.
Final Take
UTIAMC’s breakout above ₹1,401 completes a textbook Rounded Cup pattern with volume confirmation. The price has cleared major resistances and shows strength above its EMA. As long as the price sustains above ₹1,375–₹1,390 in the short term, the move toward ₹1,675–₹1,830 remains valid and actionable.
Listing Outlook- What To watch
IPO GMP Update – Mainboard IPOs
| IPO Name | Open – Close | Listing Date | GMP (Est. Listing Gain) |
|---|---|---|---|
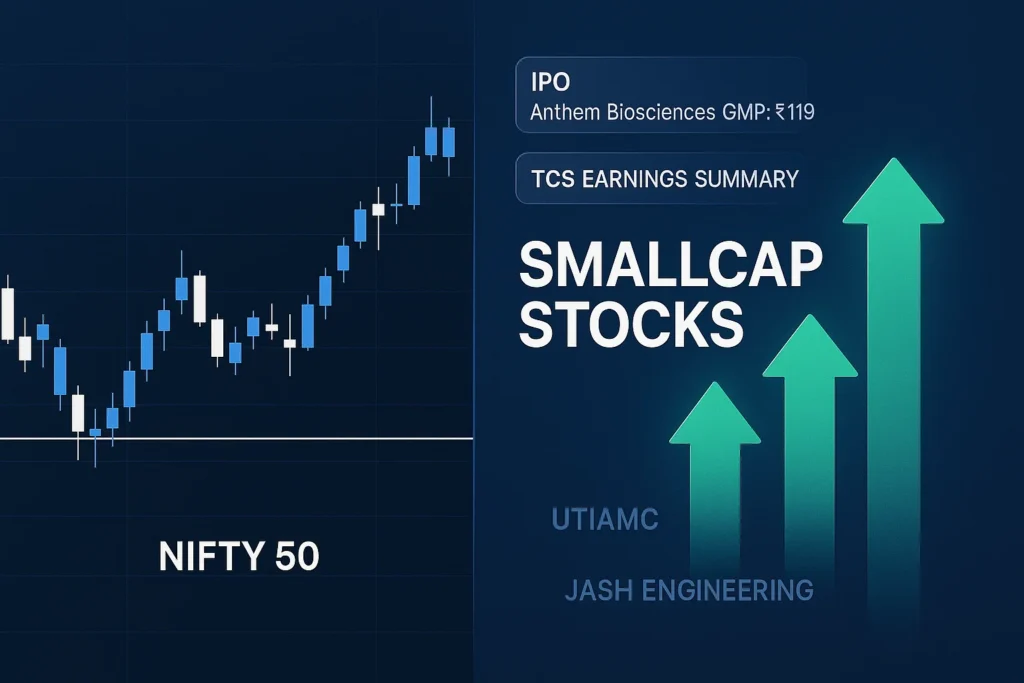
| Anthem Biosciences | 14 Jul – 16 Jul | 21 Jul | ₹119 (20.88%) |
| Smartworks Coworking | 10 Jul – 14 Jul | 17 Jul | ₹32 (7.86%) |
| Travel Food Services | 7 Jul – 9 Jul | 14 Jul | ₹5 (0.45%) |
IPO GMP Update – SME IPOs
| IPO Name | Open – Close | Listing Date | GMP (Est. Listing Gain) |
|---|---|---|---|
| Spunweb Nonwoven | 14 Jul – 16 Jul | 21 Jul | ₹13 (13.54%) |
| Asston Pharmaceuticals | 9 Jul – 11 Jul | 16 Jul | ₹30 (24.39%) |
| CFF Fluid Control | 9 Jul – 11 Jul | 16 Jul | ₹– (0.00%) |
| GLEN Industries | 8 Jul – 10 Jul | 15 Jul | ₹45 (46.39%) |
| Smarten Power Systems | 7 Jul – 9 Jul | 14 Jul | ₹9 (9.00%) |
| Chemkart India | 7 Jul – 9 Jul | 14 Jul | ₹– (0.00%) |
| Meta Infotech | 4 Jul – 8 Jul | 11 Jul | ₹50 (31.06%) |
Smallcap of the Day: Jash Engineering Ltd
Price: ₹583 | Change: +1.69%
Market Cap: ₹3,661 Cr | Sector: Industrial & Water Infrastructure

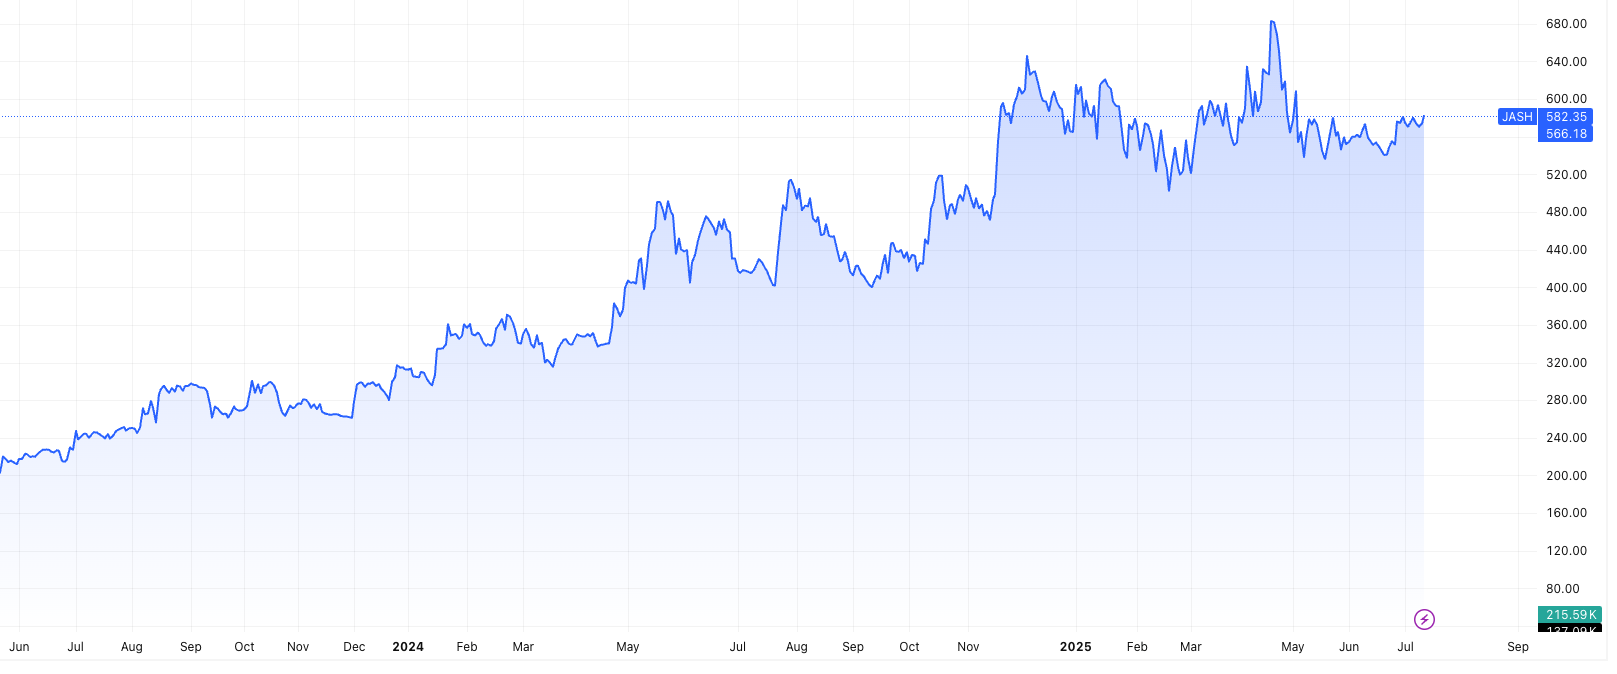
Amidst a range-bound session captured in the Market Outlook 11 July, Jash Engineering Ltd quietly stood out, reflecting underlying strength in select industrial smallcaps.
Business Overview
Jash Engineering is a leading manufacturer of water intake, control, and wastewater treatment equipment. Its operations span across sectors such as:
- Water and wastewater management
- Power and desalination plants
- Steel, petrochemical, and cement industries
The company exports to over 45 countries and offers end-to-end solutions—from design to testing—under one roof, making it a dominant player in its niche.
Product Portfolio
- Water Control Equipment: Sluice, flap, weir gates, knife gate valves
- Wastewater Screening Systems: Mechanical bar screens, drum and step screens
- Bulk Material Valves: Diverter and rotary valves
- Aeration & Mixing Solutions: Diffusers, mixers, and agitators
Key Financials
| Metric | Value |
|---|---|
| Sales (FY25) | ₹735 Cr |
| Profit After Tax | ₹86.8 Cr |
| Operating Profit | ₹127 Cr |
| ROCE / ROE | 25.0% / 22.1% |
| EPS Growth (3Y CAGR) | 36.9% |
| Debt-to-Equity | 0.23 |
| Stock P/E | 42.2 |
| Book Value | ₹69 |
| Intrinsic Value (Est.) | ₹302 |
With solid profitability, low leverage, and consistent export performance, Jash Engineering remains a structurally strong pick in the smallcap space.
Final Take
As highlighted in the Market Outlook 11 July, broader indices showed mild correction, but quality smallcaps like Jash Engineering displayed resilience. With rising global infrastructure demand and the company’s leadership in water solutions, the stock remains one to watch in the coming quarters.
Conclusion – Market Outlook 11 July
Despite the headline indices closing lower on 11 July, the underlying market tone remains cautiously optimistic. Nifty 50 continued its consolidation near the 9-EMA, suggesting a potential breakout if key resistance levels are crossed. Midcaps and smallcaps, however, continue to quietly outperform — with selective accumulation clearly visible in fundamentally strong names.
In this edition, we covered:
- Nifty’s technical outlook and trading scenarios
- Key corporate developments including TCS earnings, LIC stake sale, and US-India trade talks
- A detailed spotlight on UTIAMC as a breakout candidate and Jash Engineering Ltd as the smallcap of the day
- IPO buzz across mainboard and SME segments, with strong GMP traction in names like Anthem Biosciences and GLEN Industries
The takeaway? While largecaps consolidate, smallcaps surge ahead, and the market is rewarding stock-specific stories backed by earnings strength, regulatory wins, or sectoral tailwinds.
Stay selective, stay data-driven — and let technicals guide your short-term trades.

More Articles
How to Transfer Shares from Groww to Zerodha – Full Guide (2025)
Why Fundamentals Are Failing—and Market Cycles Are Getting Shorter
How a Tea Seller Used the Power of Compound Interest to Build ₹45 Lakh