Introduction
In trading, a single candlestick can reveal a major shift in market momentum. It doesn’t need to be loud—just precise enough to signal that buyers are stepping in and sellers are losing control. That’s the power of bullish candlestick patterns.
For intraday and swing traders, these patterns are more than just chart visuals. They reflect market psychology—showing how prices react at key support levels and how sentiment can flip in a moment.
This blog will focus on the 5 best single bullish candlestick patterns. These patterns often appear at the end of a downtrend. They don’t shout. They hint. And smart traders know how to listen.
If you’re new to trading or want to fine-tune your entries, this is a great place to start. These patterns are simple, reliable, and—when used correctly—can help you spot opportunities before the crowd does.
What Are Bullish Candlestick Patterns?
Bullish candlestick patterns are visual signals on a price chart that suggest buyers are taking control. These patterns often form at the end of a downtrend and signal a possible reversal or bounce.
In simple terms, they tell you:
📉 The selling pressure is weakening
📈 Buyers are stepping in with strength

Each candlestick reflects a battle between bulls and bears. A bullish pattern means the bulls may be winning.
But here’s the key—don’t rely on candlesticks alone. Use them with other tools like support/resistance levels, trendlines, or indicators (like RSI and MACD). When a bullish candle forms near a key support level, it becomes more powerful.
Also, keep an eye on volume. A bullish candle with high volume shows strong conviction.
These patterns work best in trending markets, especially after pullbacks or sharp drops. If you combine them with a good entry plan and risk management, they can become powerful tools in your trading setup.
Now, let’s look at the top 5 single candlestick patterns that every trader should know.
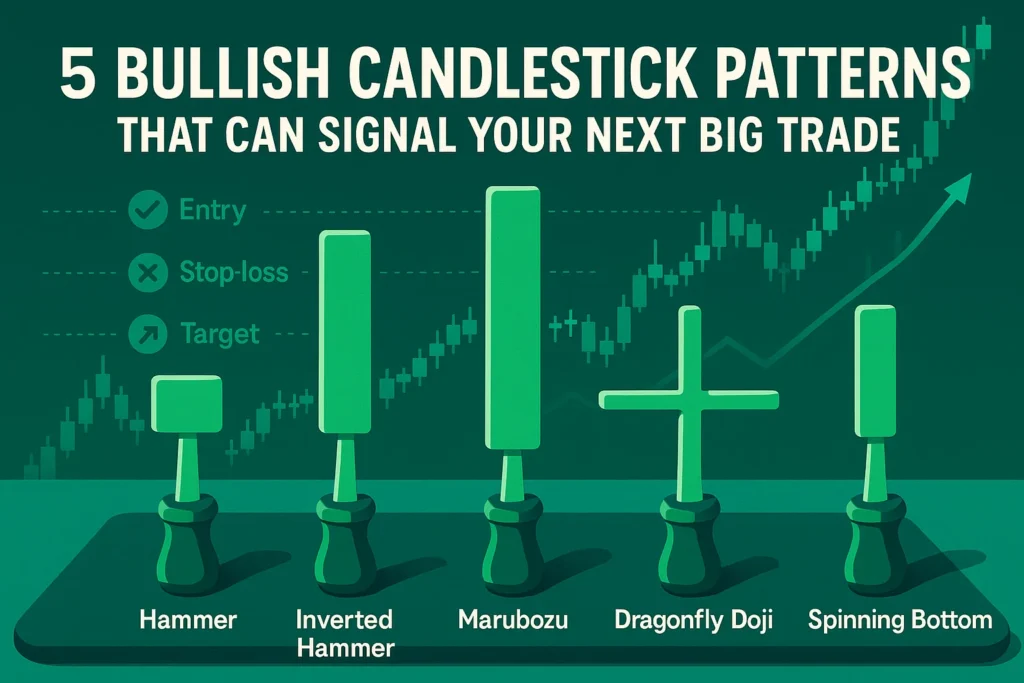
Top 5 Bullish Candlestick Patterns Every Trader Should Know
These single-candle patterns may look simple, but they can signal powerful reversals—especially when they appear after a strong downtrend or at key support levels. Let’s explore each one.
Hammer 🪓
How the Hammer Candle Forms
The hammer is a single candlestick pattern that forms when a stock opens, drops significantly during the session, but then rallies to close near or above its opening price. Visually, it has a small body near the top and a long lower shadow that’s at least 2x the size of the body. The upper wick is either very small or nonexistent.

This structure shows that sellers had control early on, but buyers came back strongly by the end of the candle—“hammering” the price back up.
What the Hammer Pattern Tells Us
The hammer signals a potential bullish reversal. It reflects buying pressure at lower levels, suggesting that demand is returning. This shift in momentum makes it a classic setup for bottom-fishers and reversal traders.
However, a hammer alone doesn’t guarantee a reversal—it sets the stage for a possible move, but confirmation is key.
When Is the Hammer Pattern Useful?
The hammer works best in the following market situations:
✅ After a strong downtrend: It’s a potential sign that selling is exhausting and reversal is near.
✅ At key support zones: If the candle forms around a known support level or trendline, it becomes more reliable.
⚠️ Sideways markets: Less effective. It may just be noise within a range.
❌ During an uptrend: It loses meaning—don’t treat it as a continuation pattern.
How to Trade the Hammer Pattern

Here’s a practical approach to trading the hammer:
🔹 Entry:
Wait for the next candle to close above the hammer’s high. That confirms the bullish intent.
🔹 Stop-loss:
Place your stop-loss below the low of the hammer candle. It’s the logical invalidation point—if price breaks below it, the reversal failed.
🔹 Target:
Use the nearest resistance level as your first target. If it’s part of a larger trend reversal (on daily or weekly charts), you can trail stop-loss and ride the trend.
When to Ignore:
- If volume is very low—it may be a weak signal.
- If it forms inside a tight sideways range—it could be a trap.
- If the candle forms after a rally, it is not a hammer (it’s likely a hanging man, which is bearish).
Inverted Hammer 🔄
How the Inverted Hammer Candle Forms
The inverted hammer is a single candlestick pattern with a small real body at the lower end and a long upper shadow that is at least twice the size of the body. It has little to no lower wick.
This candle forms when the price opens, moves higher significantly during the session, but sellers push it back down before close—yet it still closes near its open.
While sellers were active near the high, the fact that buyers could push the price up so aggressively from the start shows potential buying interest—especially after a downtrend.

What the Inverted Hammer Pattern Tells Us
The inverted hammer is a potential bullish reversal signal. It shows that buyers tried to reverse the trend during the session but faced resistance. However, their ability to drive prices higher—despite some rejection—suggests a possible shift in momentum.
This pattern reflects buyer interest emerging at the bottom, and if followed by a strong green candle, it can signal the beginning of a reversal.
When Is the Inverted Hammer Pattern Useful?
The inverted hammer is most reliable in these conditions:
✅ After a downtrend: It suggests buyers are testing strength and may take over soon.
✅ At strong demand/support zones: It adds weight to the reversal story.
❌ During sideways or uptrend: In this case, it loses context and shouldn’t be used as a bullish sign.
⚠️ If volume is very low: Be cautious. It may just be a random candle.
How to Trade the Inverted Hammer Pattern

Here’s how to trade it with clarity:
🔹 Entry:
Wait for the next candle to break and close above the inverted hammer’s high. This confirms the buyer strength hinted at in the prior session.
🔹 Stop-loss:
Place your stop-loss below the low of the inverted hammer. If price breaks that level, it invalidates the pattern.
🔹 Target:
Target depends on the timeframe:
- For intraday or short-term: Use the nearest resistance or swing high.
- For positional trading: Trail your stop-loss upward and ride the trend.
When to Ignore:
- If the next candle is red or weak—it shows no follow-through.
- If the candle forms in a tight range or consolidation—it lacks conviction.
- If the candle’s upper wick isn’t at least 2x the body—it might not be a true inverted hammer.
Bullish Marubozu 📈
How the Bullish Marubozu Candle Forms
The bullish marubozu is one of the simplest yet most powerful candlestick patterns. It forms when a stock opens at its low and closes at its high, with no upper or lower wick (or very tiny shadows). This creates a solid, full-bodied green candle.

It tells a clear story: buyers were in complete control from the first tick to the last.
There was no hesitation, no rejection, no pullback—just pure buying pressure.
What the Bullish Marubozu Pattern Tells Us
This pattern signals strong bullish momentum. It usually appears when a breakout is happening or when buyers aggressively step in after a short correction.
Unlike hammer or inverted hammer, which reflect indecision turning into potential reversal, the bullish marubozu screams confidence. It says: “Buyers dominated this session—and they’re likely not done yet.”
When Is the Bullish Marubozu Pattern Useful?
This pattern works in multiple scenarios but shines in a few key ones:
✅ After a pullback in an uptrend: A strong continuation signal.
✅ After consolidation or sideways base: Can indicate a breakout.
✅ Near major support zones: Reinforces a fresh start for the bulls.
❌ After a long rally: Be cautious—it may be exhaustion rather than strength.
⚠️ In a downtrend: Use confirmation before jumping in. It might be a bull trap.
How to Trade the Bullish Marubozu Pattern

Here’s how you can approach it practically:
🔹 Entry:
If the marubozu forms at support or after consolidation, you can enter at the close or on a minor dip in the next candle.
If it breaks a resistance, wait for the next candle to confirm continuation before entering.
🔹 Stop-loss:
Set your stop-loss below the low of the marubozu candle. That level represents the day’s lowest conviction for bulls—breaking it could reverse the sentiment.
🔹 Target:
- First target can be the next resistance level or swing high.
- For positional trades, trail your stop-loss using previous candle lows or short moving averages (like the 9-EMA).
When to Ignore:
- If it forms after an extended uptrend, especially with no volume—it could be a blow-off top.
- If it forms in isolation, without support from trend or volume, consider skipping.
Dragonfly Doji 🐉
How the Dragonfly Doji Candle Forms
A dragonfly doji is a special candlestick pattern where the open, high, and close are almost the same, but there is a long lower shadow. The candle has no upper wick (or a very tiny one), and the entire price action for the session was below the open/close.
This happens when the market opens, sells off heavily, but then buyers come in strong and push the price all the way back up to where it started.

The result? A cross-like candle that shows buyers fought hard and won the session, even if the battle got ugly in between.
What the Dragonfly Doji Pattern Tells Us
This pattern reflects strong rejection of lower prices. Although bears dominated the early session, bulls completely took over by the close.
It’s a classic sign of indecision turning into strength—especially if it forms after a downtrend. But remember, it’s still a doji. That means you must wait for confirmation in the next candle before acting.
When Is the Dragonfly Doji Pattern Useful?
This pattern works best when:
✅ At the bottom of a downtrend: Signals a possible reversal
✅ Near a strong support zone or demand area: Reinforces the bounce
✅ With increasing volume: Adds conviction to the signal
❌ In a sideways market: May have no real impact
❌ After a rally: Could be a warning sign instead (doji at the top ≠ bullish)
How to Trade the Dragonfly Doji Pattern

Use a disciplined setup, because this pattern requires confirmation.
🔹 Entry:
Buy only if the next candle breaks above the high of the dragonfly doji. This confirms that bulls are following through.
🔹 Stop-loss:
Place your stop-loss below the low of the dragonfly doji. That’s the lowest point bears reached—if broken, the reversal setup fails.
🔹 Target:
- For short-term trades: Use recent resistance or a 1:2 risk–reward ratio.
- For swing trades: Ride the move with a trailing stop or target the next supply zone.
When to Ignore:
- If the next candle is weak or red—it cancels the bullish setup.
- If the lower wick isn’t significantly long, it’s not a true dragonfly doji.
- If it forms in a low-volume area, the pattern may lack strength.
Spinning Bottom 🌀
How the Spinning Bottom Candle Forms
The spinning bottom is a candlestick with a small real body centered between long upper and lower shadows. The color of the candle (green or red) doesn’t matter much—what matters is that neither buyers nor sellers could fully dominate.

The price moved significantly in both directions during the session, but eventually closed near where it opened. This forms a “spinning” appearance, with the body like a hub and the wicks like blades.
It represents market indecision, but if it appears after a clear downtrend, it can hint at a possible reversal or pause.
What the Spinning Bottom Pattern Tells Us
This pattern shows that both bulls and bears were active during the session, but neither side had enough strength to take control.
On its own, a spinning bottom is neutral. But when it appears after a sharp fall, especially near a key support level or demand zone, it can be the first sign that selling pressure is weakening and buyers are preparing to step in.
Think of it as the market “catching its breath” before potentially changing direction.
When Is the Spinning Bottom Pattern Useful?
The spinning bottom can work in several contexts, but here’s when it’s most effective:
✅ After a strong downtrend: Suggests potential for a bounce or trend reversal
✅ At major support or demand levels: Makes it more reliable
⚠️ During a sideways market: Often meaningless or part of a larger range
❌ After a rally: Can be a pause, but not bullish—watch for weakness
How to Trade the Spinning Bottom Pattern

Because it’s an indecision candle, confirmation is everything. You trade it only if the market shows clear intent in the next session.
🔹 Entry:
Enter only after a strong bullish candle closes above the high of the spinning bottom. That’s your confirmation that buyers are stepping in with strength.
🔹 Stop-loss:
Place your stop-loss just below the low of the spinning bottom. This limits your risk in case the market continues down.
🔹 Target:
- For quick trades: Use the nearest resistance or a predefined risk-reward ratio (1:2 or better)
- For swing trades: Let price move toward the next supply zone, trailing your stop as it climbs
When to Ignore:
- If volume is low—it may just be noise
- If followed by a red candle—momentum remains with sellers
- If it forms randomly within a choppy range—avoid overtrading
Final Thoughts: Candles Don’t Lie, But They Whisper
Bullish candlestick patterns are powerful—but they aren’t magic. A hammer won’t reverse a trend on its own. A dragonfly doji won’t save a stock crashing through support. But when these candles appear at the right place, at the right time, with the right confirmation—they can become high-probability trade setups.
The five patterns we’ve explored—Hammer, Inverted Hammer, Bullish Marubozu, Dragonfly Doji, and Spinning Bottom—are the essential building blocks of price action. They help you see the emotional battle behind the candles: when fear starts fading, and when buyers quietly reclaim strength.
But never trade them in isolation.
Combine them with solid support/resistance zones, trendlines, volume analysis, and momentum indicators like RSI or MACD. And most importantly—use a stop-loss. Because in trading, not every setup works. But when it does, your preparation will pay off.
So the next time the market looks weak, and you spot a long tail bouncing off support or a strong marubozu breaking resistance—pause. Zoom out. And ask:
Is this just another candle? Or is this the beginning of something big?
Want to Spot These Patterns Without Opening Every Chart?
If you’re tired of scanning hundreds of charts just to find a hammer or dragonfly doji—Angel One makes it effortless.
With Angel One’s built-in screeners, you can filter for stocks forming bullish candlestick patterns like Hammer, Bullish Marubozu, or Inverted Hammer with just one click. No more chart-hopping. No more guesswork.
📲 Open your FREE Demat account with Angel One today and start using smart tools that do the scanning for you—so you can focus on the trades that matter.
Frequently Asked Questions (FAQs)
1. What are bullish candlestick patterns?
Bullish candlestick patterns are specific price formations on a chart that suggest buyers are gaining control and the price may rise.
2. Are single candlestick patterns reliable for trading?
Yes, especially when combined with support/resistance levels, volume, and confirmation from the next candle.
3. Which is the most powerful bullish candlestick pattern?
The Bullish Marubozu is one of the strongest—it shows buyers controlled the price from open to close with no resistance.
4. Can I use bullish candlestick patterns in intraday trading?
Absolutely. Patterns like the Hammer and Marubozu are widely used in both intraday and swing trading.
5. How do I confirm a bullish pattern before trading?
Look for the next candle closing above the high of the pattern and check if volume supports the move.
6. Do these patterns work in sideways markets?
Not really. Candlestick patterns are more effective after a trend, not inside tight ranges.
7. Should I use indicators along with candlestick patterns?
Yes. Tools like RSI, MACD, and moving averages improve accuracy and filter false signals.
8. Can I automate finding these patterns?
Yes. Platforms like Angel One offer screeners that help you spot bullish candlestick patterns in one click.
9. Where should I place stop-loss when trading these patterns?
Usually below the low of the pattern candle—that’s your invalidation point.
10. Are bullish candlestick patterns suitable for beginners?
Definitely. They are easy to learn, visually clear, and help beginners understand market psychology quickly.